RAG Trick: Embeddings are Spheres
Most embedding models normalize embeddings to 1.0. There’s a lot of tricks you can do with this.
Takeaways:
- Only use dot product, ignore all other distance measures
- The “average embedding” trick is functionally the same as a logistic regression. The reason to choose one vs another is a software design question.
Embeddings are Normalized
Are they really? Well, yeah, in practice just about any embedding you’ll touch is normalized. It’s a good idea to read the documentation to verify, but all models from all these companies are normalized:
“Normalized to 1” means that every vector has length 1.0. If you think of a triangle, the hypotenuse,
the longest side, is the vector length. When you normalize, you keep that triangle exactly the same
shape, but adjust the lengths of the sides such that the hypotenuse is 1.0.
This article applies only to normalized embeddings.
💡 Only Use Dot Product
Cosine similarity and dot product are exactly the same for vectors that have been normalized to
length 1.0. There’s a lot of proofs of this on the Internet, but intuitively, cosine similarity
is effectively normalizing each vector and then doing a dot product. So if the vectors are already
normalized, then further normalizing them does nothing, it’s just a dot product.
Euclidean distance is technically not the same. It’ll return numbers in the range (0, 2)
instead of (-1, 1). But those numbers scale up and down with cosine similarity. Ranking and clustering
all behave identically under Euclidean distance and dot product.
Dot product is the simplest of the calculations, it uses the fewest operations. It’s the fastest and cheapest to run, and delivers the same functional result, why use anything else?
💡 Embeddings Are On A (Hyper)Sphere
By definition. A circle is a series of points exactly radius r away from the center. For a sphere,
it’s the same but in 3 dimensions. For 1536 dimensions, it’s called a hypersphere.
For me, that made a lot of things seem a lot easier to visualize. I hope that helps.
💡 A Logistic Regression is a Circular Bounding “Box”
A logistic regression is a classifier where you draw a “line” to separate “the wheat from the chaff”, so to speak. The things on one side of the line are go one way (e.g. “yes”) and the other side go the opposite way (e.g. “no”). In 3D it’s called a plane, and in 1536D it’s a hyperplane.
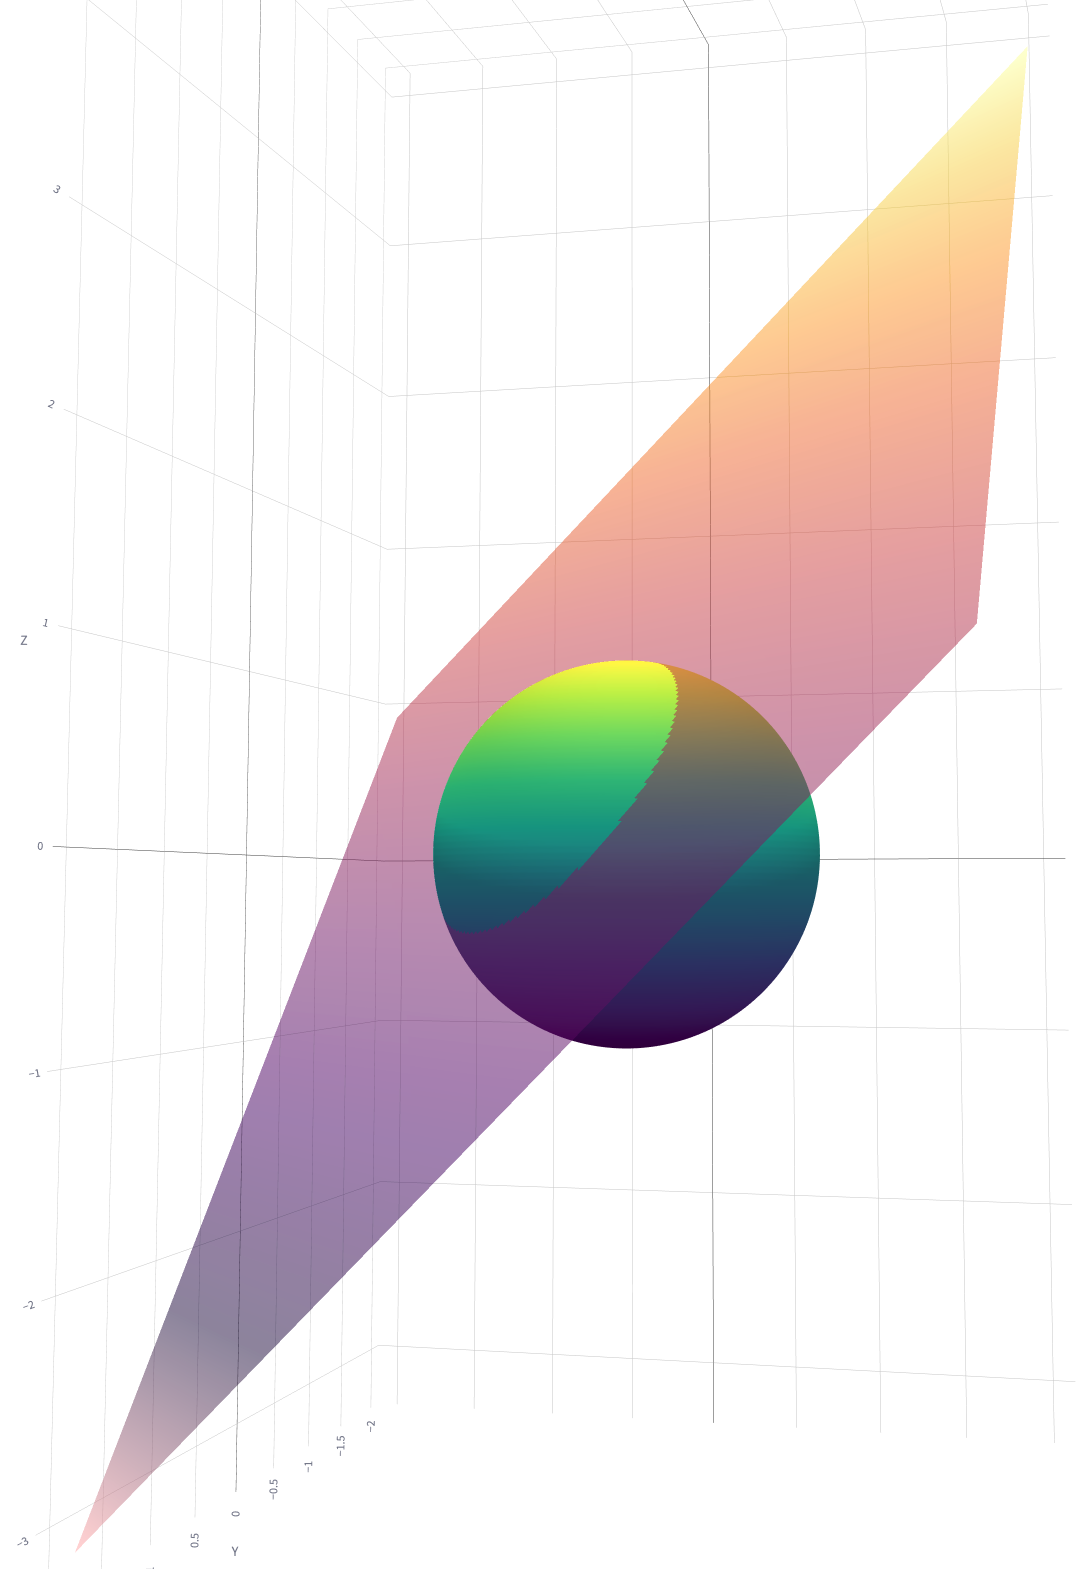
Where that plane intersects with the sphere, it makes a circle. The plane is the decision boundary of the logistic regression. So a logistic regression on a unit sphere is roughly the same as finding some central point and scratching a circle around it.
💡 The “Avergage Embedding” Trick Is Also A Circle On A Sphere
The average embedding trick is where you take a set of similar embeddings and average them together. When you see new data, you compute how far the new embedding is from the centroid. If it’s close, it’s part of the group, otherwise not.
In the 3D graph above, you can imagine drawing a dot in the center of the small portion of the sphere.
The distance from that point is a circle (well, a n-1 dimensional hypersphere). Intuitively, you should
see the similarity between the centroid vs the logistic regression.
💡 Use Logistic Regressions
Logistic Regressions are simpler code:
import sklearn

model = sklearn.linear.LogisticRegression()
model.fit(positive_embeddings)

is_true = model.predict([new_embedding])
Whereas for centroids:
import numpy as np

centroid = np.mean(positive_embeddings, axis=0)

# Find this manually
THRESHOLD = 0.01

def euclidean_distance(embedding, centroid):
    return np.sqrt(np.sum((embedding - centroid) ** 2))

# Calculate Euclidean distances from the average vector
distance = euclidean_distance(new_embedding, average_vector)
is_true = distance < THRESHOLD
The upsides of logistic regression vs centroids:
- Automatically learn (calculate) the circle radius
- Cleaner code
The downsides of logistic regression vs centroids:
- Need positive & negative examples, whereas centroids only use positive examples
- Serializing sklearn models is annoying
If you have both positive and negative examples, use a logistic regression. It’s cleaner and gives you more control with less responsibility and the same effect.
Why Simplify?
Because it’s complex enough already. Why scratch our heads over which distance metric to use when they’re all functionally the same. And just use logistic regressions, if you have the negative examples. It’ll save you some headaches later, and the code for working with them is a ton more readable.
“AI Engineering” is still largely just software engineering. The little bits of math we need to do are often a distraction from everything else going on. Simplifications like this help scale your team.